Insight into Options
Options not only expose volatility as a tradeable instrument, but also provide a unique opportunity to undertake specific risks with asymmetric payoffs. When actively monitored and managed, options are extremely efficient tools that allow for nimble portfolio management and the ability to isolate exposure over precise time horizons.
Option Volatility & Skew
Inherent to an option’s value is its implied volatility
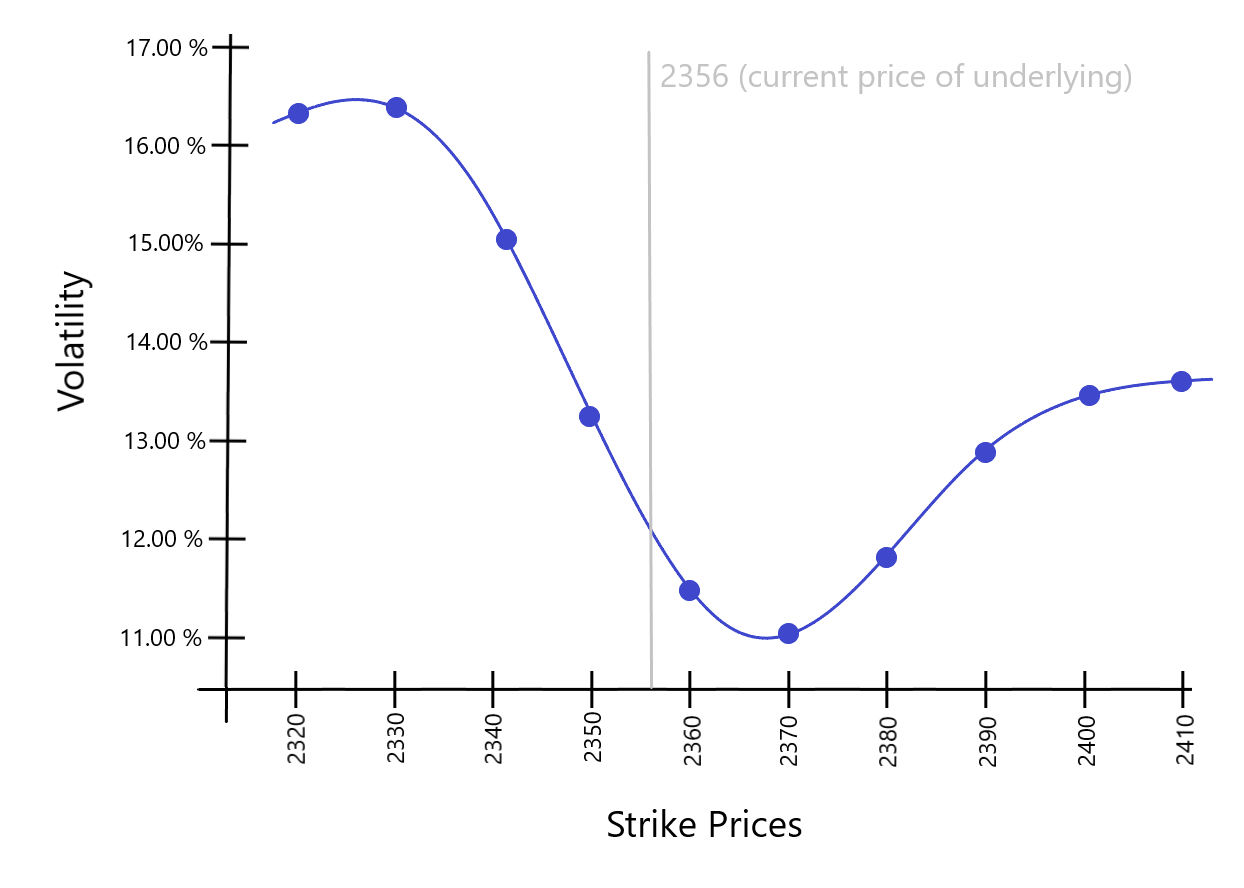
- Volatility is a measure of anticipated risk at this instant in time.
- Each strike has its own volatility.
- A Skew is visualized by plotting a range of strike prices and their volatilities for an option expiration.
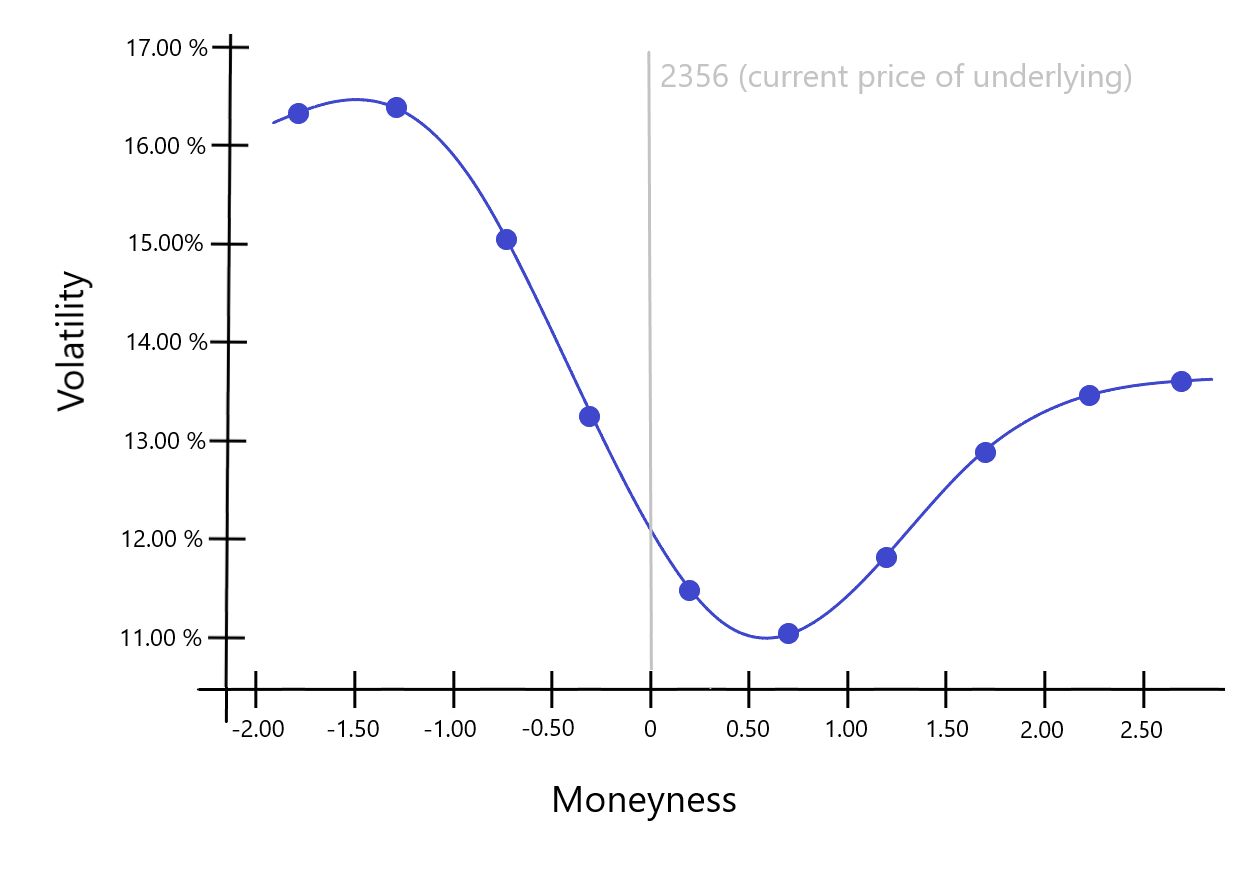
Understanding a strike’s relation to underlying price
- In order to understand “riskiness”, strike price can be transformed into a “risk distance” (moneyness) from the current underlying asset price.
- With proprietary modeling, these distance are computed for this instant in time.
- Through this abstraction, options can be compared by their probabilistic risk levels.
Expirations & Time
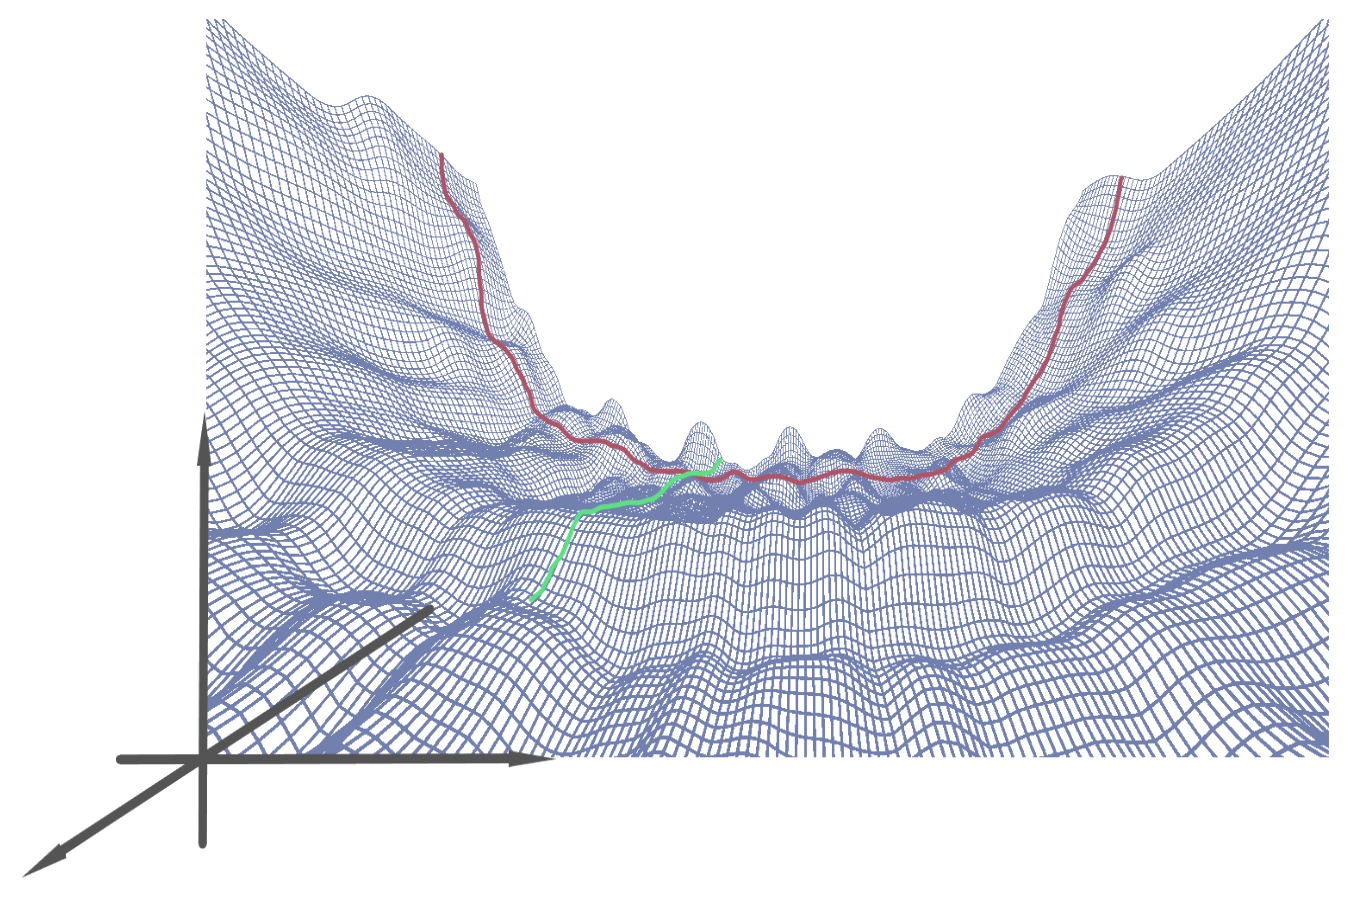
Multiple option expirations combine to create the volatility surface
- The volatility surface is the relationship of risk over different maturities, for this instant in time.
- A Surface is created by 3D plotting the skew for each expiration.
- The term structure for a given risk can be visualized for this instant in time.
Risk through time
An instantaneous volatility surface signifies the current structure of risk. But, skews and the surface itself morph through time, market environment, and sentiment. With proprietary modeling, patterns of variability and risk congruities over time periods can be understood.
Waves & Skew Influences
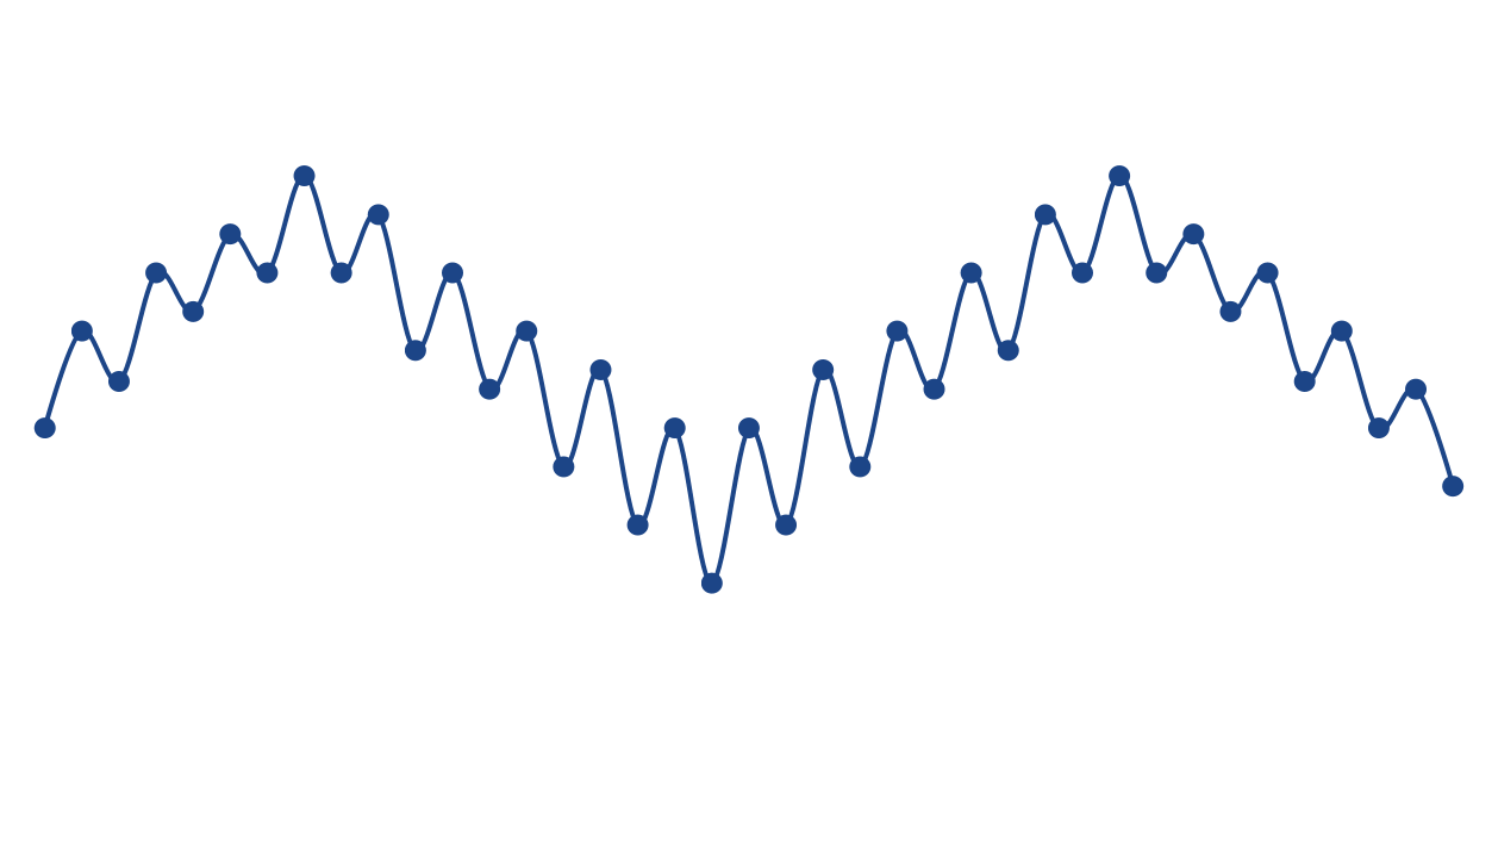
Skews act and react like waves
A wave contains smaller waves (segments of the skew) within the larger wave (skew of an option expiration)
Influencing Variables
- Waves: tides, other waves, pressure, wind, etc…
- Skew: time, volatility, underlying price distribution, and underlying movement
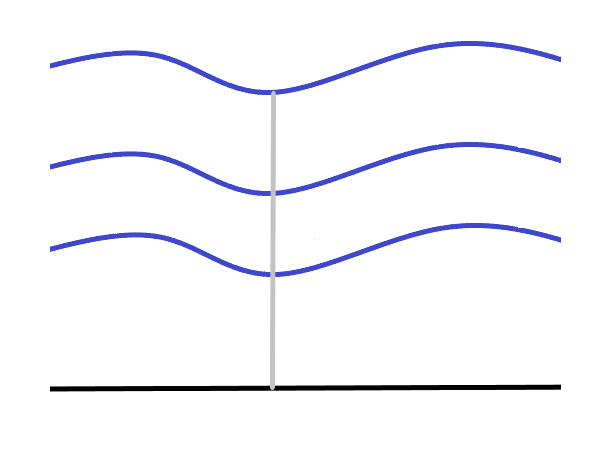
Level
‘Wave Levels’ rise and fall just as changes to Volatility raise and lower the entire skew
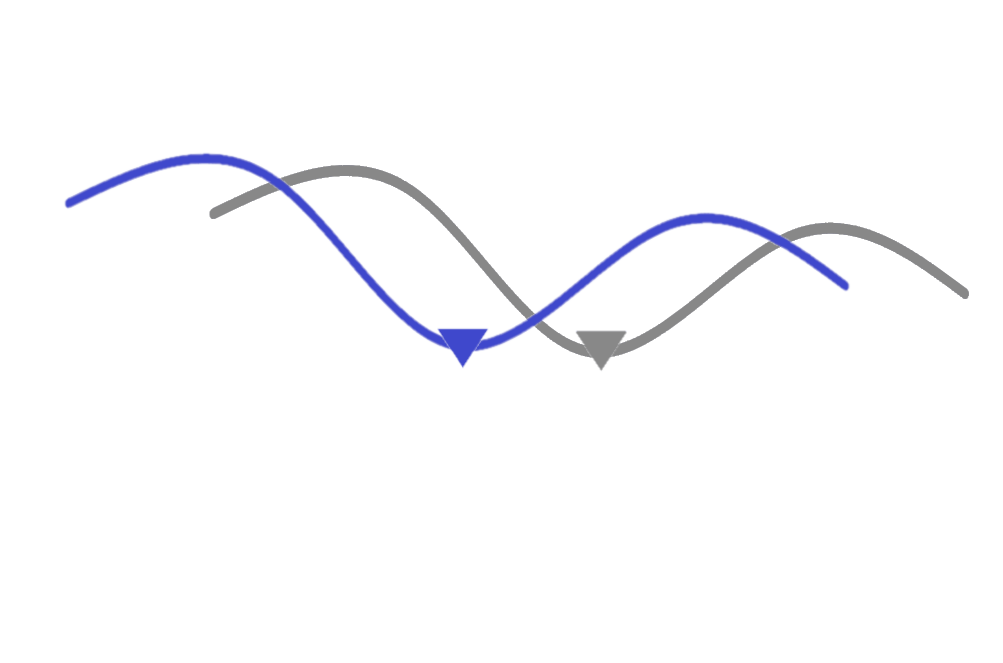
Rolling
‘Rolling’ of a skew can be caused by underlying price movement
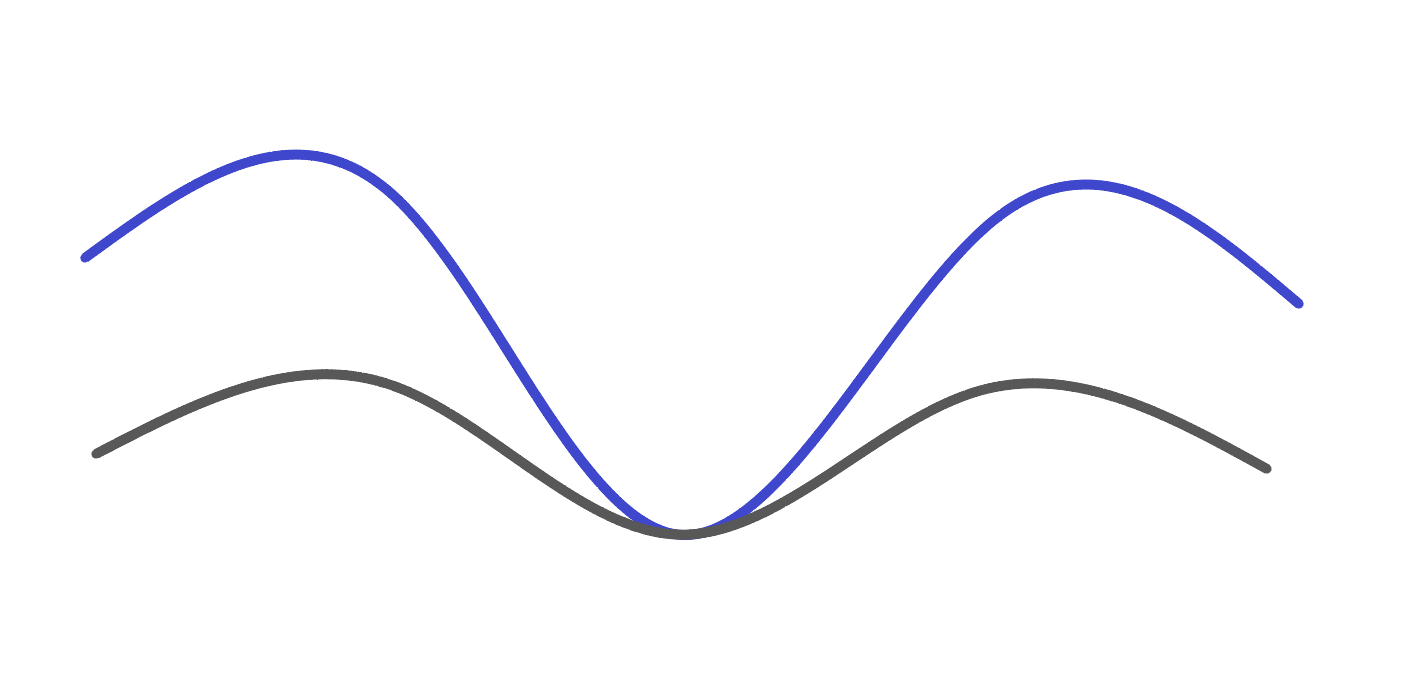
Height & Shape
Changes to a skew’s height and shape can be affected by time, volatility, and underlying price distribution
Wavelength
Elasticity of the skew is influenced by a combination of variables
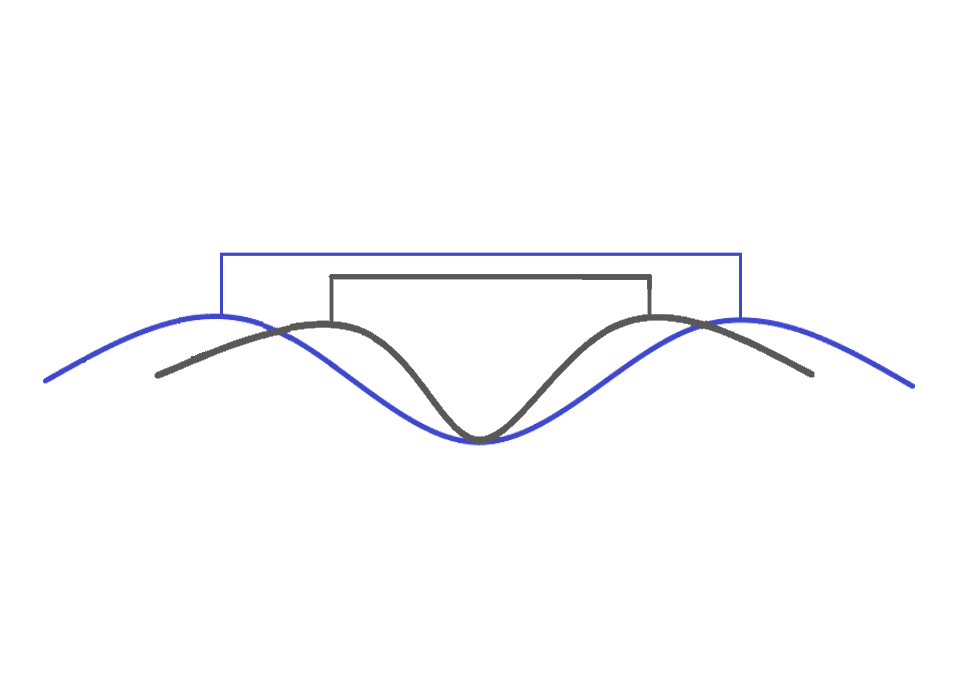
Skew Transformations
Skews in Different Volatility Environments
Blue Skew in High Volatility
Grey Skew in Normal Volatility
Light Grey Skew in Low Volatility
Pivot points occur where fluctuations intersect
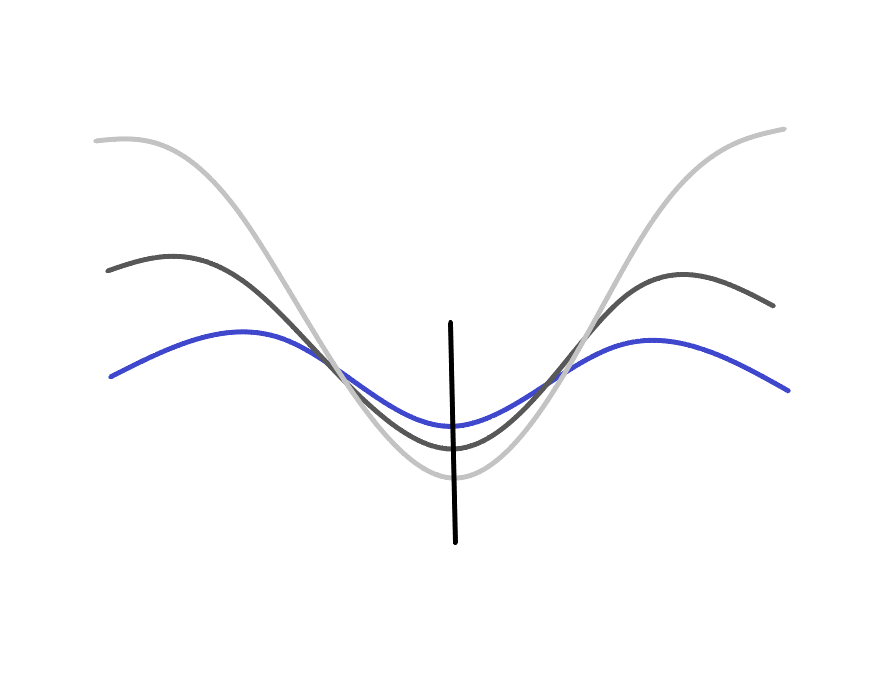
Monitoring Skew Changes
Rolling due to underlying price changes
Level, Height, and Shape transformations due to a shifting underlying price distribution and movement, volatility, and/or time
Wavelength stretch
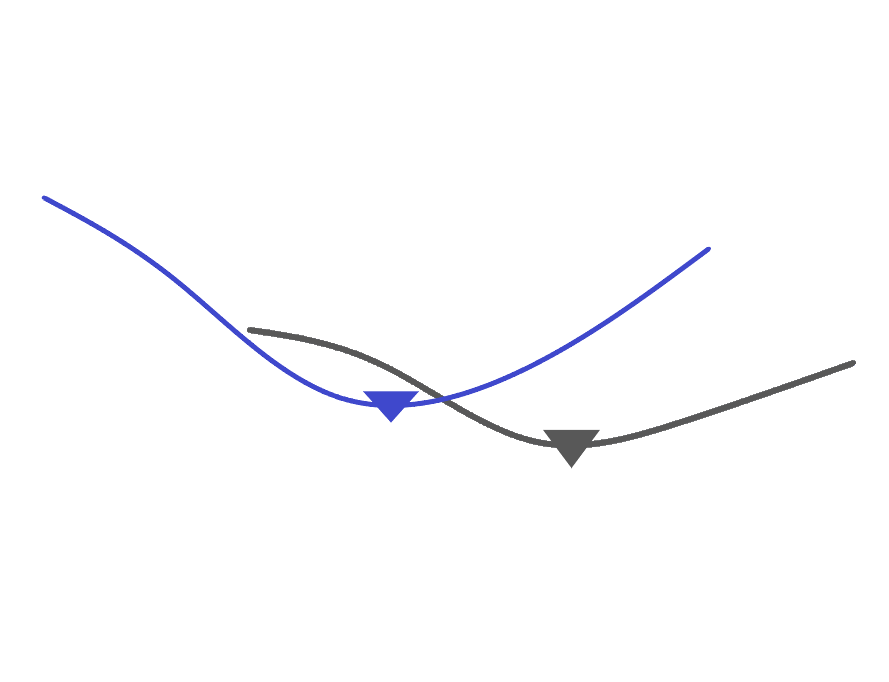
Skew Pathways
Skews can be analyzed and modeled to follow probabilistic transformation paths

Opportunities Lie in Complexity
Options risk through time follows a complex path due to the inherent variability of skews
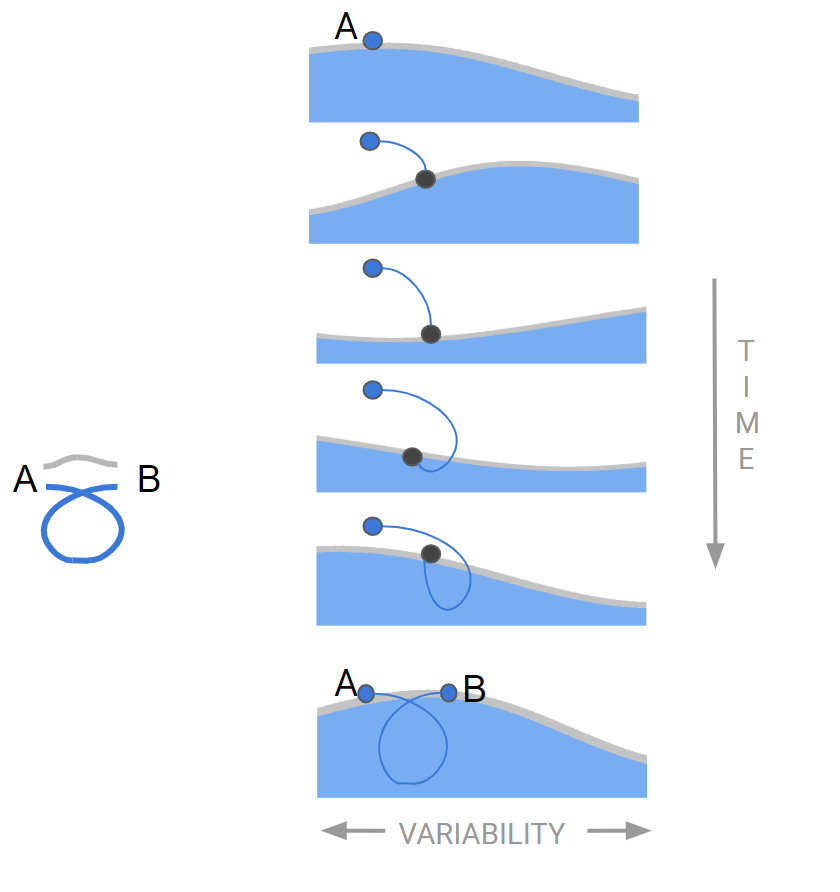
Tracking a point on the surface of a wave
There are multiple factors that push and pull at its location, as described above: tide, other waves, wind, etc..
As observer does not know precisely where that point will be the next time observed, but they can make a reasonable estimate based on their assumptions
Path from A to B
So, the observer can guess where the point may be in the future, but do they know the path it will take to get there?
An intuitive path is a connect the dots solution. (Grey Path)
In reality, the path is more complex when tracked. (Blue Path)
The path interpolated by an observer can be interpreted as perceived risk of an option investment.
